Temel İstatistikler
| Kurumsal Sahipler | 223 total, 222 long only, 0 short only, 1 long/short - change of -4,86% MRQ |
| Ortalama Portföy Dağıtımı | 0.1046 % - change of 2,46% MRQ |
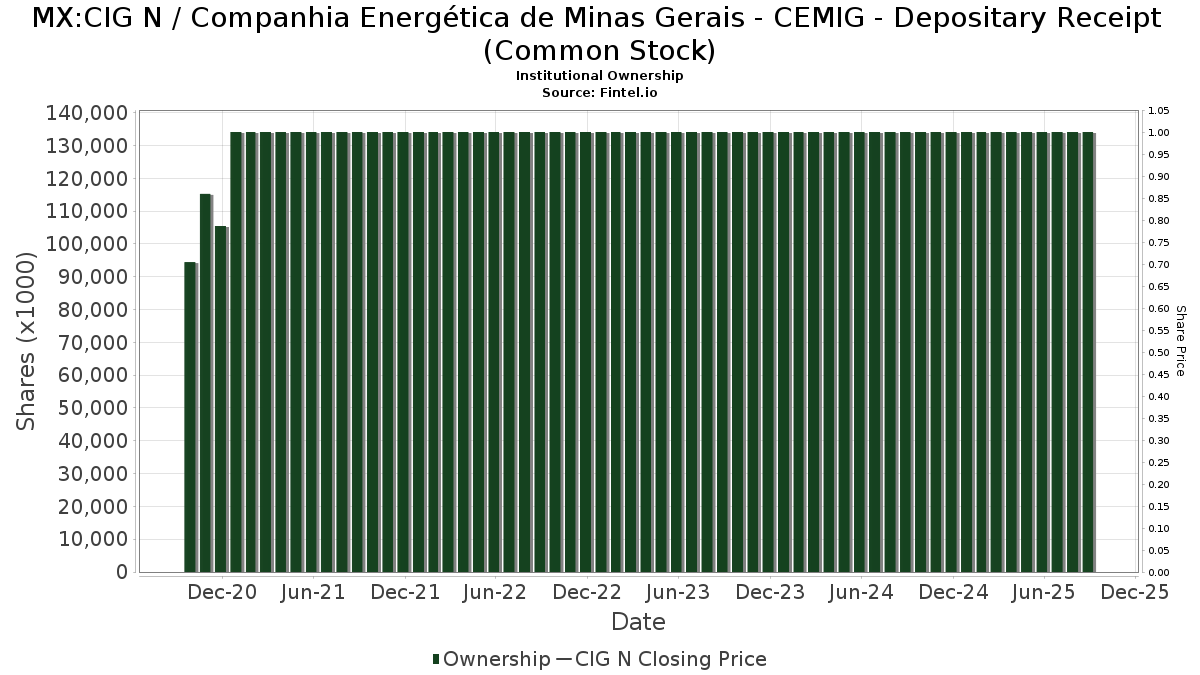
| Kurumsal Hisseler (Uzun) | 140.088.865 (ex 13D/G) - change of 19,42MM shares 16,93% MRQ |
| Kurumsal Değer (Uzun) | $ 288.076 USD ($1000) |
Kurumsal Mülkiyet ve Hissedarlar
Companhia Energética de Minas Gerais - CEMIG - Depositary Receipt (Common Stock) (MX:CIG N) var 223 Menkul Kıymetler Borsası Komisyonuna (SEC) 13D/G veya 13F formları dolduran kurumsal sahipler ve hissedarlar. Bu kurumların toplam 140,088,865 hissesi bulunmaktadır. En büyük hissedarlar arasındakiler: Goldman Sachs Group Inc, BlackRock, Inc., State Street Corp, Vanguard Group Inc, Renaissance Technologies Llc, SPEM - SPDR(R) Portfolio Emerging Markets ETF, VGTSX - Vanguard Total International Stock Index Fund Investor Shares, Mangrove Partners, American Century Companies Inc, and VEIEX - Vanguard Emerging Markets Stock Index Fund Investor Shares .
Companhia Energética de Minas Gerais - CEMIG - Depositary Receipt (Common Stock) (BMV:CIG N) kurumsal mülkiyet yapısı, kurum ve fonlara göre şirketteki mevcut pozisyonların yanı sıra pozisyon büyüklüğündeki son değişiklikleri gösterir. Büyük hissedarlar bireysel yatırımcıları, yatırım fonlarını, hedge fonlarını veya kurumları içerebilir. Çizelge 13D, yatırımcının şirketin %5inden fazlasını elinde bulundurduğunu (veya elinde önceden bulundurduğunu) ve iş stratejisinde aktif olarak bir değişiklik yapmayı planladığını (veya önceden planladığını) gösterir. Çizelge 13G, %5in üzerinde pasif yatırımı gösterir.
Fon Eğilim Skoru
Fon Eğilim Skoru (diğer adıyla Sahiplik Birikimi Skoru), fonlar tarafından en çok satın alınan hisse senetlerini bulur. En yüksek düzeyde kurumsal birikime sahip şirketleri tanımlayan karmaşık, çok faktörlü kantitatif bir modelin sonucudur. Skorlama modeli, açıklanan sahiplerdeki toplam artışın, bu sahiplerdeki portföy dağıtımındaki değişikliklerin ve diğer ölçümlerin bir kombinasyonunu kullanır. Sayı 0dan 100e kadar değişir; daha yüksek sayılar emsallerine göre daha yüksek bir birikim düzeyine işaret eder ve 50 ortalamadır.
Güncelleme Sıklığı: Günlük
En üst düzey şirketlerin listesini sağlayan Sahiplik Gezginine bakın.
AI+ Ask Fintel’s AI assistant about Companhia Energética de Minas Gerais - CEMIG - Depositary Receipt (Common Stock).
Select a question to share a public post with an AI-crafted answer.
Thinking of good questions…
13F ve NPORT Başvuruları
13F başvurularına ilişkin ayrıntılar ücretsizdir. NP başvurularına ilişkin ayrıntılar premium üyelik gerektirir. Yeşil satırlar yeni pozisyonları gösterir. Kırmızı satırlar kapalı pozisyonları gösterir. Tam işlem geçmişini görmek için linkesimgesine tıklayınız.
Yükseltin
premium verilerin kilidini açmak ve Excele aktarmak için ![]() .
.
| Dosya Tarihi | Kaynak | Yatırımcı | Tür | Ortalama Fiyat (Tahmin) |
Hisseler | Δ Hisseler (%) |
Bildirilen Değer (1000$) |
Δ Değer (%) |
Bağlantı Noktası Dağıtımı (%) |
|
|---|---|---|---|---|---|---|---|---|---|---|
| 2025-09-25 | NP | DFSE - Dimensional Emerging Markets Sustainability Core 1 ETF | 33.910 | 0,00 | 61 | -4,69 | ||||
| 2025-08-28 | NP | CWI - SPDR(R) MSCI ACWI EX-US ETF | 338.263 | 0,35 | 663 | 11,64 | ||||
| 2025-11-13 | 13F | Renaissance Technologies Llc | 8.274.649 | 12,64 | 17.460 | 21,26 | ||||
| 2025-11-13 | 13F | Guggenheim Capital Llc | 608.027 | -0,07 | 1.283 | 7,55 | ||||
| 2025-11-14 | 13F | CI Private Wealth, LLC | 589.503 | -0,23 | 1.244 | 7,34 | ||||
| 2026-01-05 | 13F | GAMMA Investing LLC | 16.454 | 14,40 | 33 | 6,67 | ||||
| 2026-02-06 | 13F | EverSource Wealth Advisors, LLC | 25.894 | 14,74 | 52 | 8,51 | ||||
| 2026-02-03 | 13F/A | Bank Of America Corp /de/ | 588.256 | -90,35 | 1.241 | -89,61 | ||||
| 2026-02-04 | 13F | Pure Financial Advisors, Inc. | 66.185 | 0,00 | 132 | -5,04 | ||||
| 2026-02-02 | 13F | Qrg Capital Management, Inc. | 137.806 | -9,02 | 276 | -13,79 | ||||
| 2025-11-13 | 13F | O'shaughnessy Asset Management, Llc | 67.653 | 16,01 | 143 | 24,56 | ||||
| 2025-11-12 | 13F | Group One Trading, L.p. | Put | 500 | 0,00 | 1 | ||||
| 2025-08-27 | NP | Brighthouse Funds Trust I - SSGA Emerging Markets Enhanced Index Portfolio Class B | 27.600 | 0,00 | 54 | 12,50 | ||||
| 2025-09-25 | NP | TWAAX - Thrivent International Allocation Fund Class A | 0 | -100,00 | 0 | -100,00 | ||||
| 2025-09-26 | NP | UBPIX - Ultralatin America Profund Investor Class | 43.139 | 14,07 | 78 | 9,86 | ||||
| 2025-11-12 | 13F | Group One Trading, L.p. | Call | 20.800 | -34,38 | 44 | -30,65 | |||
| 2026-01-23 | 13F | Robeco Institutional Asset Management B.V. | 2.773.413 | 0,00 | 5.547 | -5,21 | ||||
| 2025-11-12 | 13F | Group One Trading, L.p. | 7.780 | 16 | ||||||
| 2025-11-14 | 13F | United Capital Financial Advisers, Llc | 2.271.963 | 1,15 | 4.794 | 8,88 | ||||
| 2025-08-14 | 13F | Citadel Advisors Llc | Put | 0 | -100,00 | 0 | -100,00 | |||
| 2025-08-18 | NP | PACIFIC SELECT FUND - Emerging Markets Portfolio Class I | 29.500 | 58 | ||||||
| 2025-11-14 | 13F | Cubist Systematic Strategies, LLC | 58.950 | 124 | ||||||
| 2026-02-03 | 13F | Ethic Inc. | 79.105 | 46,20 | 158 | 38,60 | ||||
| 2025-11-12 | 13F | Simplex Trading, Llc | Call | 14.500 | 1.218,18 | 0 | ||||
| 2025-11-13 | 13F | Van Eck Associates Corp | 373.472 | -16,77 | 1 | |||||
| 2025-08-14 | 13F | Lazard Asset Management Llc | 0 | -100,00 | 0 | |||||
| 2026-01-20 | 13F | Signaturefd, Llc | 178.505 | -1,48 | 357 | -6,54 | ||||
| 2025-11-12 | 13F | Xponance, Inc. | 21.869 | 13,55 | 46 | 24,32 | ||||
| 2026-01-08 | 13F | True Wealth Design, LLC | 4 | 0,00 | 0 | |||||
| 2025-11-14 | 13F | Northern Trust Corp | 1.919.706 | 0,61 | 4.051 | 8,32 | ||||
| 2025-11-13 | 13F | Franklin Resources Inc | 258.951 | 15,54 | 546 | 24,37 | ||||
| 2026-01-21 | 13F | Yousif Capital Management, Llc | 23.272 | 0,00 | 47 | -4,08 | ||||
| 2025-11-12 | 13F | American Century Companies Inc | 4.488.070 | 19,08 | 9.470 | 28,18 | ||||
| 2025-09-25 | NP | VEIEX - Vanguard Emerging Markets Stock Index Fund Investor Shares | 4.339.107 | 0,00 | 7.854 | -4,23 | ||||
| 2025-11-13 | 13F | Pinnacle Wealth Planning Services, Inc. | 25.539 | 54 | ||||||
| 2025-11-13 | 13F | Mackenzie Financial Corp | 519.308 | 22,43 | 1.096 | 31,77 | ||||
| 2026-02-04 | 13F | Argos Wealth Advisors, LLC | 18.935 | 38 | ||||||
| 2025-11-10 | 13F | Optiver Holding B.V. | 0 | -100,00 | 0 | |||||
| 2025-09-24 | NP | SGIDX - Steward Global Equity Income Fund Class A | 3.997 | -3,43 | ||||||
| 2025-09-23 | NP | GERIX - Goldman Sachs Emerging Markets Equity Insights Fund Institutional | 118.300 | -12,69 | 214 | -16,41 | ||||
| 2026-01-15 | 13F | Allspring Global Investments Holdings, LLC | 10.793 | 22 | ||||||
| 2025-08-12 | 13F | Coldstream Capital Management Inc | 0 | -100,00 | 0 | |||||
| 2025-11-13 | 13F | Dodge & Cox | 15.000 | 0,00 | 32 | 6,90 | ||||
| 2025-08-20 | NP | NATIONWIDE VARIABLE INSURANCE TRUST - NVIT GS Emerging Markets Equity Insights Fund Class Y | 225.500 | 0,00 | 442 | 11,36 | ||||
| 2025-11-13 | 13F | Rehmann Capital Advisory Group | 30.628 | 0,24 | 65 | 8,47 | ||||
| 2026-01-16 | 13F | Perigon Wealth Management, LLC | 159.131 | 318 | ||||||
| 2026-02-02 | 13F | Principal Financial Group Inc | 207.165 | 8,98 | 414 | 3,24 | ||||
| 2026-02-06 | 13F | Pzena Investment Management Llc | 1.080.784 | -46,29 | 2.162 | -49,09 | ||||
| 2026-02-03 | 13F/A | Mount Yale Investment Advisors, LLC | 0 | -100,00 | 0 | |||||
| 2026-01-27 | 13F | PFG Advisors | 18.392 | 0,00 | 37 | -5,26 | ||||
| 2026-02-06 | 13F | Profund Advisors Llc | 49.768 | 31,69 | 100 | 25,32 | ||||
| 2025-09-25 | NP | VEU - Vanguard FTSE All-World ex-US Index Fund ETF Shares | 980.613 | 0,00 | 1.775 | -4,26 | ||||
| 2025-11-14 | 13F | Public Employees Retirement System Of Ohio | 379.734 | 0,00 | 801 | 7,66 | ||||
| 2026-02-06 | 13F | Banque Cantonale Vaudoise | 222.296 | 5,54 | 445 | |||||
| 2026-01-26 | 13F | Mirae Asset Global Investments Co., Ltd. | 103.450 | 2,31 | 207 | -3,29 | ||||
| 2026-01-07 | 13F | Hilltop National Bank | 8.000 | 0,00 | 16 | 0,00 | ||||
| 2025-11-13 | 13F | Wells Fargo & Company/mn | 3.294 | 28,52 | 7 | 20,00 | ||||
| 2026-02-02 | 13F | Truist Financial Corp | 26.041 | -5,12 | 52 | -8,77 | ||||
| 2025-11-14 | 13F | Quantinno Capital Management LP | 10.150 | 21 | ||||||
| 2025-11-14 | 13F | VPR Management LLC | 147.547 | 0,00 | 311 | 7,61 | ||||
| 2026-02-10 | 13F | Connor, Clark & Lunn Investment Management Ltd. | 2.248.460 | 0,09 | 4.497 | -5,13 | ||||
| 2025-09-25 | NP | DEXC - Dimensional Emerging Markets ex China Core Equity ETF | 33.600 | 0,00 | 61 | -4,76 | ||||
| 2025-11-13 | 13F | Fmr Llc | 31.023 | 1,01 | 65 | 8,33 | ||||
| 2026-01-30 | 13F | Simplicity Wealth,LLC | 10.918 | 22 | ||||||
| 2025-11-19 | 13F | Caitong International Asset Management Co., Ltd | 534 | -9,18 | 1 | 0,00 | ||||
| 2025-09-25 | NP | DFEM - Dimensional Emerging Markets Core Equity 2 ETF | 116.130 | 0,00 | 210 | -4,11 | ||||
| 2026-01-29 | 13F | Vanguard Group Inc | 13.098.258 | 0,00 | 26.197 | -5,21 | ||||
| 2025-11-14 | 13F | Jane Street Group, Llc | 258.016 | 544 | ||||||
| 2025-09-25 | NP | VGTSX - Vanguard Total International Stock Index Fund Investor Shares | 5.197.706 | 0,00 | 9.408 | -4,23 | ||||
| 2025-11-14 | 13F | Two Sigma Securities, Llc | 11.460 | -80,66 | 24 | -79,31 | ||||
| 2025-11-14 | 13F | D. E. Shaw & Co., Inc. | 364.588 | -30,03 | 769 | -24,68 | ||||
| 2026-01-26 | 13F | Harbor Asset Planning, Inc. | 8.036 | 0,00 | 16 | 0,00 | ||||
| 2026-02-06 | 13F | Global Retirement Partners, LLC | 88.685 | 65.592,59 | 177 | |||||
| 2026-02-10 | 13F | Welch & Forbes Llc | 0 | -100,00 | 0 | |||||
| 2025-09-25 | NP | DFA INVESTMENT DIMENSIONS GROUP INC - Emerging Markets Sustainability Core 1 Portfolio Institutional Class This fund is a listed as child fund of Dimensional Fund Advisors Lp and if that institution has disclosed ownership in this security, then these positions will not be double counted when calculating total shares and total value | 11.963 | 0,00 | 22 | -4,55 | ||||
| 2026-01-30 | 13F | Valued Wealth Advisors LLC | 1.329 | 0,00 | 3 | 0,00 | ||||
| 2026-02-06 | 13F | HighTower Advisors, LLC | 135.858 | -3,43 | 272 | -8,45 | ||||
| 2025-11-12 | 13F | Principal Securities, Inc. | 1.000 | 7,07 | 2 | 100,00 | ||||
| 2025-11-12 | 13F | West Family Investments, Inc. | 48.029 | 0,00 | 101 | 7,45 | ||||
| 2025-11-06 | 13F | Advisors Asset Management, Inc. | 623.087 | -0,16 | 1.315 | 7,44 | ||||
| 2025-10-08 | 13F/A | New York State Common Retirement Fund | 0 | -100,00 | 0 | -100,00 | ||||
| 2025-08-28 | NP | QEMM - SPDR MSCI Emerging Markets StrategicFactors ETF | 2.559 | -3,94 | 5 | 25,00 | ||||
| 2025-11-14 | 13F | Susquehanna International Group, Llp | Call | 31.200 | 176,11 | 66 | 195,45 | |||
| 2025-11-14 | 13F | Susquehanna International Group, Llp | 42.101 | 46,68 | 89 | 57,14 | ||||
| 2025-11-13 | 13F | Russell Investments Group, Ltd. | 413.394 | 14,00 | 872 | 22,82 | ||||
| 2025-11-10 | 13F | Atomi Financial Group, Inc. | 39.333 | 19,07 | 83 | 28,13 | ||||
| 2025-08-27 | NP | THRIVENT SERIES FUND INC - Thrivent Partner Emerging Markets Equity Portfolio Class A | 29.794 | -50,37 | 58 | -44,76 | ||||
| 2026-02-09 | 13F | Legal & General Group Plc | 1.421.852 | 0,00 | 2.851 | -4,30 | ||||
| 2026-01-21 | 13F | Prime Capital Investment Advisors, LLC | 57.741 | -1,00 | 115 | -6,50 | ||||
| 2025-08-12 | 13F | Proequities, Inc. | Put | 0 | 0 | |||||
| 2025-08-12 | 13F | Proequities, Inc. | Call | 0 | 0 | |||||
| 2025-08-12 | 13F | Proequities, Inc. | 0 | 0 | ||||||
| 2025-12-23 | 13F/A | Triumph Capital Management | 21.440 | 0,00 | 45 | 7,14 | ||||
| 2026-01-20 | 13F | AdvisorNet Financial, Inc | 2.413 | 0,00 | 5 | -20,00 | ||||
| 2025-11-14 | 13F | Tower Research Capital LLC (TRC) | 2.619 | 6 | ||||||
| 2025-11-14 | 13F | Royal Bank Of Canada | 253.227 | -5,73 | 535 | 1,52 | ||||
| 2025-08-28 | NP | SPGM - SPDR(R) Portfolio MSCI Global Stock Market ETF | 18.938 | 2,96 | 37 | 15,63 | ||||
| 2025-11-26 | 13F/A | Jpmorgan Chase & Co | 302.470 | -13,27 | 638 | -6,59 | ||||
| 2025-08-28 | NP | KOMP - SPDR S&P Kensho New Economies Composite ETF This fund is a listed as child fund of State Street Corp and if that institution has disclosed ownership in this security, then these positions will not be double counted when calculating total shares and total value | 3.635.064 | 7.125 | ||||||
| 2025-11-14 | 13F | Squarepoint Ops LLC | 96.689 | 111,61 | 204 | 129,21 | ||||
| 2026-01-16 | 13F | Ronald Blue Trust, Inc. | 73.752 | -16,26 | 148 | -20,54 | ||||
| 2025-11-14 | 13F | Qtron Investments LLC | 295.828 | 34,69 | 624 | 45,12 | ||||
| 2025-11-06 | 13F | Metis Global Partners, LLC | 137.662 | 32,98 | 290 | 43,56 | ||||
| 2025-11-12 | 13F | Simplex Trading, Llc | 0 | -100,00 | 0 | |||||
| 2025-11-14 | 13F | Brevan Howard Capital Management LP | 52.017 | 110 | ||||||
| 2026-02-10 | 13F | Acadian Asset Management Llc | 0 | -100,00 | 0 | |||||
| 2025-11-12 | 13F | Barclays Plc | 0 | -100,00 | 0 | |||||
| 2025-08-27 | NP | THRIVENT SERIES FUND INC - Thrivent International Allocation Portfolio Class A | 69.170 | -49,33 | 136 | -43,75 | ||||
| 2026-01-29 | 13F | UBS Group AG | 203.395 | -85,33 | 407 | -86,12 | ||||
| 2025-11-14 | 13F | Advisor Group Holdings, Inc. | 9.069 | 0,00 | 18 | 5,88 | ||||
| 2026-02-03 | 13F | Sequoia Financial Advisors, LLC | 56.668 | 0,68 | 113 | -4,24 | ||||
| 2026-01-26 | 13F | Abundance Wealth Counselors | 68.157 | 9,96 | 136 | 4,62 | ||||
| 2025-09-29 | NP | VRAI - Virtus Real Asset Income ETF | 89.354 | 5,60 | 162 | 1,26 | ||||
| 2025-10-27 | 13F | First Horizon Corp | 0 | -100,00 | 0 | |||||
| 2025-11-12 | 13F | Stifel Financial Corp | 697.410 | 9,83 | 1.472 | 18,25 | ||||
| 2025-08-12 | 13F | Virtu Financial LLC | 0 | -100,00 | 0 | |||||
| 2026-01-21 | 13F | TSP Capital Management Group, LLC | 18.106 | -5,99 | ||||||
| 2026-01-23 | 13F | Eagle Bay Advisors LLC | 16.000 | 32 | ||||||
| 2026-01-26 | 13F | Invested Advisors | 25.517 | 33,63 | 51 | 50,00 | ||||
| 2025-11-13 | 13F | Banco BTG Pactual S.A. | 49.600 | -17,33 | 105 | -11,11 | ||||
| 2026-02-11 | 13F | Parallel Advisors, LLC | 9.245 | 0,00 | 18 | -5,26 | ||||
| 2025-10-28 | 13F | BRYN MAWR TRUST Co | 1.896 | 0,00 | 4 | 33,33 | ||||
| 2025-08-28 | NP | SPEM - SPDR(R) Portfolio Emerging Markets ETF | 5.911.037 | 8,65 | 11.586 | 20,99 | ||||
| 2025-11-14 | 13F | Qube Research & Technologies Ltd | 67.154 | 1,02 | 142 | 8,46 | ||||
| 2026-02-03 | 13F | SBI Securities Co., Ltd. | 33.493 | 75,13 | 67 | 65,00 | ||||
| 2026-01-26 | 13F | Cwm, Llc | 2.407 | -42,44 | 0 | |||||
| 2025-11-14 | 13F | Millennium Management Llc | 1.471.400 | 27,44 | 3.105 | 37,16 | ||||
| 2026-02-02 | 13F | Ativo Capital Management LLC | 586.421 | -5,19 | 1.173 | -10,19 | ||||
| 2025-11-04 | 13F | Gitterman Wealth Management, LLC | 161.340 | 9,22 | 340 | 17,65 | ||||
| 2025-11-17 | 13F | Great West Life Assurance Co /can/ | 674.408 | -5,30 | 1 | 0,00 | ||||
| 2025-11-12 | 13F | First Trust Advisors Lp | 18.849 | -31,98 | 40 | -27,78 | ||||
| 2025-11-10 | 13F | Citigroup Inc | 735.686 | 0,32 | 1.552 | 8,00 | ||||
| 2025-11-12 | 13F | LPL Financial LLC | 0 | -100,00 | 0 | -100,00 | ||||
| 2025-08-13 | 13F | Employees Retirement System of Texas | 0 | -100,00 | 0 | |||||
| 2025-11-14 | 13F | Truvestments Capital Llc | 357 | 0,00 | 1 | |||||
| 2025-11-20 | 13F | Ariadne Wealth Management, LP | 21.362 | 0,00 | 47 | 9,52 | ||||
| 2025-11-14 | 13F | Hrt Financial Lp | 69.965 | 0 | ||||||
| 2025-11-14 | 13F | Vident Advisory, LLC | 508.039 | 4,56 | 1.072 | 12,50 | ||||
| 2026-02-06 | 13F | Pnc Financial Services Group, Inc. | 46.638 | 2,66 | 93 | -2,11 | ||||
| 2025-11-14 | 13F | Morgan Stanley | 3.883.895 | -24,38 | 8.195 | -18,60 | ||||
| 2025-10-31 | 13F | JustInvest LLC | 36.658 | -21,33 | 77 | -15,38 | ||||
| 2025-11-14 | 13F | Engineers Gate Manager LP | 21.622 | -54,34 | 46 | -51,09 | ||||
| 2026-01-30 | 13F | Precision Wealth Strategies, LLC | 63.668 | -19,18 | 127 | -23,49 | ||||
| 2025-11-14 | 13F | Ameriprise Financial Inc | 27.767 | -0,07 | 59 | 5,45 | ||||
| 2025-11-14 | 13F | State Street Corp | 13.698.625 | 0,27 | 30.684 | 2,99 | ||||
| 2026-02-10 | 13F | Greenspring Advisors, LLC | 14.832 | 30 | ||||||
| 2025-11-14 | 13F | Ieq Capital, Llc | 46.003 | 159,74 | 97 | 185,29 | ||||
| 2025-08-28 | NP | CNRG - SPDR S&P Kensho Clean Power ETF This fund is a listed as child fund of State Street Corp and if that institution has disclosed ownership in this security, then these positions will not be double counted when calculating total shares and total value | 1.173.500 | 2.300 | ||||||
| 2026-01-05 | 13F | Park Avenue Securities Llc | 0 | -100,00 | 0 | |||||
| 2025-09-25 | NP | DFA INVESTMENT DIMENSIONS GROUP INC - World ex U.S. Core Equity Portfolio Institutional Class Shares | 12.652 | 0,00 | 23 | -4,35 | ||||
| 2025-11-14 | 13F | Two Sigma Investments, Lp | 1.026.782 | -16,60 | 2.167 | -10,24 | ||||
| 2025-11-21 | 13F | Bell Investment Advisors, Inc | 1.020 | 0,00 | 2 | 0,00 | ||||
| 2025-09-25 | NP | DFAE - Dimensional Emerging Core Equity Market ETF | 418.570 | 0,00 | 758 | -4,30 | ||||
| 2026-01-13 | 13F | Stableford Capital Ii Llc | 38.225 | 0,00 | 76 | -5,00 | ||||
| 2026-01-23 | 13F | Farther Finance Advisors, LLC | 348.457 | 1,48 | 697 | -3,87 | ||||
| 2026-02-10 | 13F | Envestnet Asset Management Inc | 116.091 | -95,10 | 232 | -95,36 | ||||
| 2025-11-14 | 13F | Evergreen Wealth Solutions, LLC | 24.798 | 3,94 | 52 | 13,04 | ||||
| 2025-08-12 | 13F | Segall Bryant & Hamill, Llc | 0 | -100,00 | 0 | |||||
| 2025-11-12 | 13F | SPX Equities Gestao de Recursos Ltda | 320.778 | 1.385,56 | 677 | 1.509,52 | ||||
| 2025-08-20 | NP | QSPIX - AQR Style Premia Alternative Fund Class I | 335.036 | -32,16 | 657 | -24,51 | ||||
| 2026-01-16 | 13F | Vanguard Capital Wealth Advisors This fund is a listed as child fund of Vanguard Group Inc and if that institution has disclosed ownership in this security, then these positions will not be double counted when calculating total shares and total value | 50.300 | 42,49 | 101 | 35,14 | ||||
| 2025-11-13 | 13F | Invesco Ltd. | 368.873 | -63,33 | 778 | -60,53 | ||||
| 2026-01-08 | 13F | Traveka Wealth, LLC | 12.725 | 0,00 | 25 | -3,85 | ||||
| 2025-11-13 | 13F | Pathstone Holdings, LLC | 82.055 | -3,64 | 173 | 4,22 | ||||
| 2025-11-14 | 13F | Amundi | 1.058.866 | 0,00 | 2.128 | 1,53 | ||||
| 2025-11-14 | 13F | Mercer Global Advisors Inc /adv | 53.309 | -12,63 | 112 | -5,88 | ||||
| 2025-11-12 | 13F | Steward Partners Investment Advisory, Llc | 0 | -100,00 | 0 | |||||
| 2025-11-24 | 13F | CIBC Private Wealth Group, LLC | 1 | 0,00 | 0 | |||||
| 2026-02-10 | 13F | Bnp Paribas Arbitrage, Sa | 41.034 | 0,00 | 82 | -4,65 | ||||
| 2025-11-13 | 13F | Arrowstreet Capital, Limited Partnership | 1.414.697 | -37,16 | 2.985 | -32,34 | ||||
| 2025-11-14 | 13F | XTX Topco Ltd | 193.259 | 408 | ||||||
| 2025-11-12 | 13F | Modern Wealth Management, LLC | 48.876 | 4,33 | 103 | 13,19 | ||||
| 2025-08-28 | NP | GII - SPDR(R) S&P GLOBAL INFRASTRUCTURE ETF | 321.444 | 1,95 | 630 | 13,72 | ||||
| 2025-11-04 | 13F | Jones Financial Companies Lllp | 1.045 | 2 | ||||||
| 2025-11-13 | 13F | Hsbc Holdings Plc | 904.644 | 7,20 | 1.909 | 15,36 | ||||
| 2026-02-05 | 13F | Abacus Wealth Partners, LLC | 10.113 | 20 | ||||||
| 2025-11-14 | 13F | National Bank Of Canada /fi/ | 27.022 | -26,37 | 56 | -21,13 | ||||
| 2025-08-26 | NP | EMIF - iShares Emerging Markets Infrastructure ETF | 102.730 | -31,37 | 201 | -23,57 | ||||
| 2025-11-13 | 13F | Brown Brothers Harriman & Co | 902 | 0,00 | 2 | 0,00 | ||||
| 2025-11-12 | 13F | BlackRock, Inc. | 19.034.239 | 4,65 | 40.162 | 12,66 | ||||
| 2026-02-04 | 13F | Blackhawk Capital Partners LLC. | 24.337 | 0,00 | 49 | -5,88 | ||||
| 2025-08-21 | NP | SMOG - VanEck Vectors Low Carbon Energy ETF | 486.911 | -4,91 | 954 | 5,88 | ||||
| 2025-11-06 | 13F | Candriam Luxembourg S.C.A. | 24.978 | -52,92 | 53 | -49,51 | ||||
| 2026-02-03 | 13F | Crossmark Global Holdings, Inc. | 4.061.011 | 1,59 | 8.122 | -3,70 | ||||
| 2026-02-10 | 13F/A | Northwestern Mutual Wealth Management Co | 9.132 | 0,00 | 18 | -5,26 | ||||
| 2025-11-13 | 13F | Marshall Wace, Llp | 1.017.139 | 3.121,34 | 2.146 | 3.418,03 | ||||
| 2025-11-06 | 13F | Rhumbline Advisers | 33.366 | -38,68 | 70 | -33,96 | ||||
| 2025-11-14 | 13F | Raymond James Financial Inc | 0 | -100,00 | 0 | |||||
| 2025-09-26 | NP | RTXAX - Tax-Managed Real Assets Fund Class A | 225.906 | 0,00 | 409 | -4,23 | ||||
| 2025-08-14 | 13F | Promethos Capital, LLC | 0 | -100,00 | 0 | -100,00 | ||||
| 2025-11-14 | 13F | Eqis Capital Management, Inc. | 0 | -100,00 | 0 | |||||
| 2025-11-06 | 13F | Wealthstream Advisors, Inc. | 15.247 | 25,77 | 32 | 39,13 | ||||
| 2025-11-14 | 13F | Mml Investors Services, Llc | 33.568 | 8,63 | 71 | |||||
| 2026-01-28 | 13F | Geneos Wealth Management Inc. | 15.344 | 0,00 | 31 | -6,25 | ||||
| 2025-09-29 | NP | CVY - Invesco Zacks Multi-Asset Income ETF This fund is a listed as child fund of Invesco Ltd. and if that institution has disclosed ownership in this security, then these positions will not be double counted when calculating total shares and total value | 574.528 | -7,74 | 1.040 | -11,65 | ||||
| 2026-01-14 | 13F | Generali Investments CEE, investicni spolecnost, a.s. | 894.044 | 0,98 | 1.788 | -4,28 | ||||
| 2025-11-10 | 13F | Raiffeisen Bank International AG | 98.713 | 0,00 | 208 | 13,66 | ||||
| 2026-02-03 | 13F | Ballentine Partners, LLC | 31.858 | -5,70 | 64 | -11,27 | ||||
| 2025-12-01 | 13F | Investment Research Partners LLC | 34.774 | 72 | ||||||
| 2025-11-20 | 13F | First Affirmative Financial Network | 92.258 | 5,40 | 195 | 13,45 | ||||
| 2025-11-10 | 13F | MAI Capital Management | 1.540 | -92,71 | 3 | -92,68 | ||||
| 2026-01-30 | 13F | Mitsubishi UFJ Trust & Banking Corp | 36.037 | -6,00 | 72 | -10,00 | ||||
| 2026-02-05 | 13F | Allworth Financial LP | 864 | -37,12 | 2 | -50,00 | ||||
| 2025-11-13 | 13F | Quadrant Capital Group Llc | 300.476 | -33,70 | 634 | -28,60 | ||||
| 2025-11-14 | 13F | Citadel Advisors Llc | Call | 28.900 | -36,34 | 61 | -31,82 | |||
| 2026-01-15 | 13F | Nisa Investment Advisors, Llc | 3.114 | 3,80 | 6 | 0,00 | ||||
| 2025-11-14 | 13F | Virtus Investment Advisers, Inc. | 83.409 | -6,65 | 176 | 0,00 | ||||
| 2025-11-14 | 13F | Integrated Wealth Concepts LLC | 31.274 | -16,58 | 66 | -10,96 | ||||
| 2025-11-14 | 13F | Citadel Advisors Llc | 1.142.752 | 2.411 | ||||||
| 2025-11-12 | 13F | Itau Unibanco Holding S.A. | 32.314 | -96,73 | 68 | -96,49 | ||||
| 2025-08-20 | NP | REMG - Emerging Markets Equity Active ETF | 68.355 | 134 | ||||||
| 2026-01-26 | 13F | PDS Planning, Inc | 41.721 | 0,00 | 83 | -5,68 | ||||
| 2026-01-30 | 13F | Us Bancorp \de\ | 54.014 | 25,63 | 108 | 20,00 | ||||
| 2026-02-05 | 13F | Atria Investments Llc | 291.996 | 0,80 | 584 | -4,58 | ||||
| 2025-11-14 | 13F | Two Sigma Advisers, Lp | 151.532 | -72,44 | 320 | -70,38 | ||||
| 2025-11-14 | 13F | Creative Planning | 104.075 | -6,57 | 220 | 0,46 | ||||
| 2025-11-14 | 13F | Federation des caisses Desjardins du Quebec | 2.347 | -45,01 | 5 | -50,00 | ||||
| 2025-11-13 | 13F | Quadrature Capital Ltd | 147.832 | 310 | ||||||
| 2025-09-25 | NP | DFCEX - Emerging Markets Core Equity Portfolio - Institutional Class This fund is a listed as child fund of Dimensional Fund Advisors Lp and if that institution has disclosed ownership in this security, then these positions will not be double counted when calculating total shares and total value | 308.387 | 0,00 | 558 | -4,12 | ||||
| 2026-01-28 | 13F | CAPROCK Group, Inc. | 15.950 | -8,22 | 35 | -2,86 | ||||
| 2025-08-26 | NP | IGF - iShares Global Infrastructure ETF | 4.308.992 | 11,83 | 8.446 | 24,54 | ||||
| 2026-01-14 | 13F | Jfs Wealth Advisors, Llc | 585 | 0,00 | 1 | 0,00 | ||||
| 2026-02-05 | 13F | Bessemer Group Inc | 980 | 0 | ||||||
| 2025-11-13 | 13F | Sei Investments Co | 242.138 | 4,52 | 511 | 12,33 | ||||
| 2025-11-13 | 13F | Grantham, Mayo, Van Otterloo & Co. LLC | 717.492 | 0,00 | 1.514 | 7,61 | ||||
| 2026-02-05 | 13F | Everstar Asset Management, LLC | 550.276 | 10,43 | 1.101 | 4,66 | ||||
| 2026-01-27 | 13F | Checchi Capital Advisers, LLC | 11.933 | 0,00 | 24 | -8,00 | ||||
| 2026-02-10 | 13F | Eurizon Capital SGR S.p.A. | 56.506 | 115 | ||||||
| 2025-11-12 | 13F | Dimensional Fund Advisors Lp | 1.029.799 | 6,35 | 2.173 | 14,50 | ||||
| 2026-02-10 | 13F | Bank of New York Mellon Corp | 11.108 | -19,77 | 22 | -24,14 | ||||
| 2025-11-14 | 13F | Mangrove Partners | 4.600.000 | 0,00 | 9.706 | 7,65 | ||||
| 2026-01-30 | 13F | R Squared Ltd | 25.782 | -47,66 | 52 | -50,49 | ||||
| 2025-11-05 | 13F | Smartleaf Asset Management LLC | 790 | 2 | ||||||
| 2025-08-26 | 13F/A | Thrivent Financial For Lutherans | 0 | -100,00 | 0 | |||||
| 2026-02-06 | 13F | Gsa Capital Partners Llp | 0 | -100,00 | 0 | |||||
| 2025-11-14 | 13F | Manufacturers Life Insurance Company, The | 140.091 | -6,49 | 296 | 0,68 | ||||
| 2025-08-26 | NP | MCTOX - Modern Capital Tactical Opportunities Fund Class A Shares | 209.000 | -62,55 | 410 | -58,35 | ||||
| 2025-11-13 | 13F | Schroder Investment Management Group | 134.725 | -28,44 | 284 | -23,04 | ||||
| 2025-10-22 | 13F | Cerity Partners LLC | 50.065 | -23,06 | 106 | -17,32 | ||||
| 2025-11-14 | 13F | Aqr Capital Management Llc | 1.123.799 | -26,09 | 2.371 | -20,44 | ||||
| 2025-11-14 | 13F | Wetherby Asset Management Inc | 207.957 | -0,39 | 439 | 7,09 | ||||
| 2025-11-12 | 13F | Longfellow Investment Management Co Llc | 534.450 | 24,97 | 1.128 | 34,49 | ||||
| 2025-10-29 | 13F | Inspire Advisors, LLC | 10.085 | -2,10 | 21 | 5,00 | ||||
| 2026-01-23 | 13F | BSW Wealth Partners | 16.506 | 33 | ||||||
| 2026-01-08 | 13F | Tuttle Tactical Management LLC | 26.104 | 52 | ||||||
| 2025-11-14 | 13F | Point72 Asset Management, L.P. | 119.500 | 252 | ||||||
| 2026-01-27 | 13F | WealthCollab, LLC | 1.944 | 0,00 | 4 | -25,00 | ||||
| 2026-01-16 | 13F | Empirical Financial Services, LLC d.b.a. Empirical Wealth Management | 59.585 | -77,85 | 119 | -79,01 | ||||
| 2025-11-14 | 13F | Skopos Labs, Inc. | 19.054 | 40 | ||||||
| 2025-11-07 | 13F | Sierra Ocean, Llc | 0 | -100,00 | 0 | |||||
| 2026-02-05 | 13F | LGT Group Foundation | 34.085 | 0,00 | 70 | 0,00 | ||||
| 2026-02-10 | 13F | Goldman Sachs Group Inc | 19.464.437 | 99,35 | 38.929 | 88,96 | ||||
| 2025-10-30 | 13F | Canopy Partners, LLC | 18.724 | 0,00 | 40 | 8,33 | ||||
| 2025-11-14 | 13F | Mariner, LLC | 162.015 | 68,57 | 342 | 81,38 | ||||
| 2026-01-21 | 13F | Greenleaf Trust | 456.833 | 0,00 | 914 | -5,19 | ||||
| 2026-01-23 | 13F | Assetmark, Inc | 386 | 1 |